| Q&A with Eric Goldwein
| Eric Goldwein, MPH, of 320 Consulting has developed a new tool to track nursing home staff data. On Friday, October 3, Steve Gurney of Positive Aging Community and Robert Blancato of Matz Blancato discuss the Payroll-Based Journal (PBJ) with Goldwein, who will demonstrate the tool and answer your questions. (Register here.) Here, he sketches the basics.
| Who does nursing home data matter to?
Nursing home data touches a lot of parties, from the residents themselves to their family members, to the U.S. taxpayer, to those working in the nursing homes. These are data that affect people at the ground level and impact the $191 billion that goes into the nursing home or Continuing Care Retirement Community system each year.
You Don’t Need a Spreadsheet to Know We’re Failing
Nursing Home Residents
What goes into this data set? What are the sources, and how accurate is it?
PBJ is a government dataset logging every nursing home’s staffing for every position, every single day for the last eight, nine years. This is audited, albeit imperfect, data, and the best we have. You can go back to a given date — say, if a resident suffered a fall on May 7, 2021 — and find out how many RN or CNA hours were reported that day.
And you can use this data not only to zoom in by the day, but to determine trends over time and tie those to outcomes. Maybe there’s a dip in staffing level that’s associated with an increase in fall rates, or an ownership change coinciding with increased reliance on contract staff. You can use these data points to explore a number of different important metrics and get a better idea of what’s going on at these nursing homes.
How did this data set originate?
CMS moved to Payroll-Based Journal reporting in 2016 as a requirement of the Affordable Care Act. The idea was to have an audited, standardized system and upgrade on the previous system, which relied on facilities self-reporting prior to inspections. Savvy operators could more or less guess when inspectors were coming and beef up their staffing levels, juking the stats. PBJ isn’t perfect — there’s still misreporting, data entry errors, data manipulation — but it’s tougher to game, and the dataset is much richer.
PBJ pulls in daily, payroll-verifiable data, so instead of a snapshot you get a more complete picture — billions of data points with numbers on every nursing home, every single position, from the RN Administrator to CNAs to non-nurse positions like the dieticians or PT assistants.
The shift opened the door for more advanced analysis — comparing weekday vs. weekend staffing, tracking staff turnover, days where facilities failed to meet certain thresholds. Or with the PBJ Dashboard, longitudinal trends showing how staffing has shifted quarter by quarter, year by year, across a facility, state, or nationally. And when you dig even deeper, you can start to assess relationships between staffing and the outcomes that impact residents and their families — metrics such as falls, pressure ulcers, and antipsychotic use.
Let’s talk about the moment that the data froze and what might have happened and what the consequences are.
Last month, CMS froze Nursing Home Care Compare — the primary government resource for nursing home data (an excellent consumer resource) — until October in what’s been described as a data transition. They’re migrating data to a newer system and also changing some metrics, including the Health Inspection calculations, which will now focus more on the more recent surveys.
I’m cautiously optimistic this is one step back for two steps forward, and that there’s nothing nefarious here — not a sign of data obfuscation or manipulation as might be happening elsewhere. That said, these delays still cost the public: we pay for this data, and it shouldn’t take months before we see it.
Can you describe the role that Registered Nurses (RNs), Licensed Nurse Practitioners (LPNs) and Certified Nursing Assistants (CNAs) play in this ecosystem?
If a nursing staff is a football team, then your RNs are the quarterbacks, the LPNs are the running backs and receivers, and the CNAs are the offensive line, in the trenches, protecting the resident and making the facility go round. The RNs and LPNs are more trained, more expensive, and responsible for the more complex tasks — assessing patients, administering patients, creating care plans. The CNAs are providing most of the hands-on care — changing, feeding, bathing, the residents.
The data won’t tell us that one position is more important than the other — you can’t have a team of only quarterbacks or only offensive tackles. But it can reveal a facility’s priorities. Perhaps they’re replacing RNs with CNAs to cut costs. Or they’re leaning more heavily on contract staff or nurse aides in training. Data revealing shifts in positional breakdowns can reveal a larger trend at the facility and perhaps beyond.
What do the data tell us about different regions?
This is what’s so important and exciting about the PBJ data. It’s such a rich source of information — literally billions of data points — that we can assess these questions in a real, targeted way, connecting the data geographically, and then leveraging regional expertise to make meaning of the numbers, put a story to the stats.
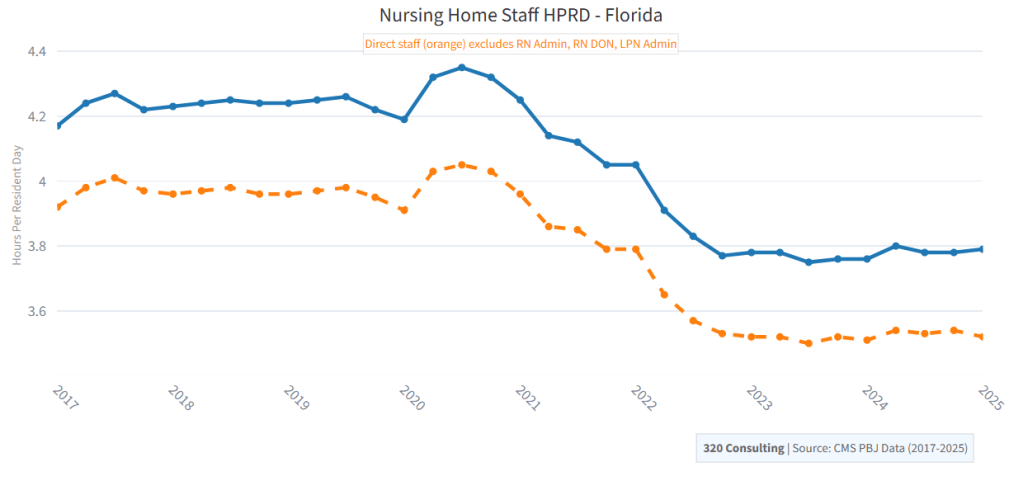
You can tie the PBJ data to other sources in and outside the long-term care space, be it Bureau of Labor Statistics, Census, you name it. Maybe there’s an influx of contract employees in the southwest region, or rising rates of pressure ulcers in county-run nursing homes in Illinois, or an increase in resident census in facilities that start with the letter R and have a phone number ending in 3.
There’s an abundance of public nursing home data — not just PBJ, but ratings, citations, health inspections, financials — and with better data tools (yes, including artificial intelligence) it’s easier to dig deeper and present the information in meaningful ways. People like you and me — representing different fields and perspectives — can more easily find out what’s happening at the 15,000+ US nursing homes and connect the data trends to the residents and workers experiencing them.

Leave a comment